 Taurine Technology
 Axon features
One clear view of every site, user and application.
Axon brings network experience, traffic visibility, site-local diagnostics, infrastructure monitoring, alerting and policy into one operations platform — with Simba to investigate the evidence when something breaks.
Multi-site consoleInline or passive per site or at an aggregation nodeUnlimited sites and devices
01 · Operations overview
One starting point for every investigation
The multi-site dashboard combines device, port, uptime and traffic health into a single status view, with a Network Pulse that shows whether a site is stable or currently changing. Recommended next actions turn telemetry into a queue instead of a collection of charts.
- Site-selectable health, throughput and notification summary
- Live traffic-ingestion status
- Unified inventory: Axon switches, endpoints, SNMP and UniFi devices
- Admin, operator and viewer roles with per-user site access
| Site | State | Score | Clients | WAN p95 |
|---|---|---|---|---|
| CPT-01 | Degraded | 87 | 312 | 71% |
| JHB-02 | Healthy | 94 | 1,048 | 44% |
| EC-SCH-11 | Healthy | 91 | 186 | 58% |
| KZN-POP-3 | Stale | — | — | — |
Fleet view — recreated, representative data. Stale sites are marked, never shown healthy.
02 · Experience and availability
A score you can interrogate, not a black box
The 0–100 Experience Score combines reliability, responsiveness, throughput and local device health — and exposes every metric behind each component.
- Component scores with a full evidence list
- Network Pulse: availability, incidents and recent recoveries
- Scheduled ping, TCP, HTTP and DNS uptime checks from inside the site
- Uptime history and response-time timelines
Diagnostic story card — trend and health are judged separately, so “stable but bad” is never hidden.
03 · Traffic visibility and intelligence
Turn encrypted flows into useful application context, without decrypting user traffic.
Axon classifies traffic at the edge using novel on-device AI and domain/SNI signals where available. Raw packets stay on site; the control plane receives bounded flow and health telemetry.
Start with the application. Drill down to the flow.
Usage by application, category, endpoint, LAN user, domain, country, ASN and provider — down to individual flows and whether each was delivered, blocked or rate-limited.
Coverage is shown, not assumed
Unattributed traffic is reported and data-availability views prevent missing telemetry from reading as zero traffic.
The destination, not just the byte count
Site-local domain-to-IP history, ASN and provider attribution, and risk enrichment against threat intelligence packs — without shipping your traffic inventory to a third-party SaaS.
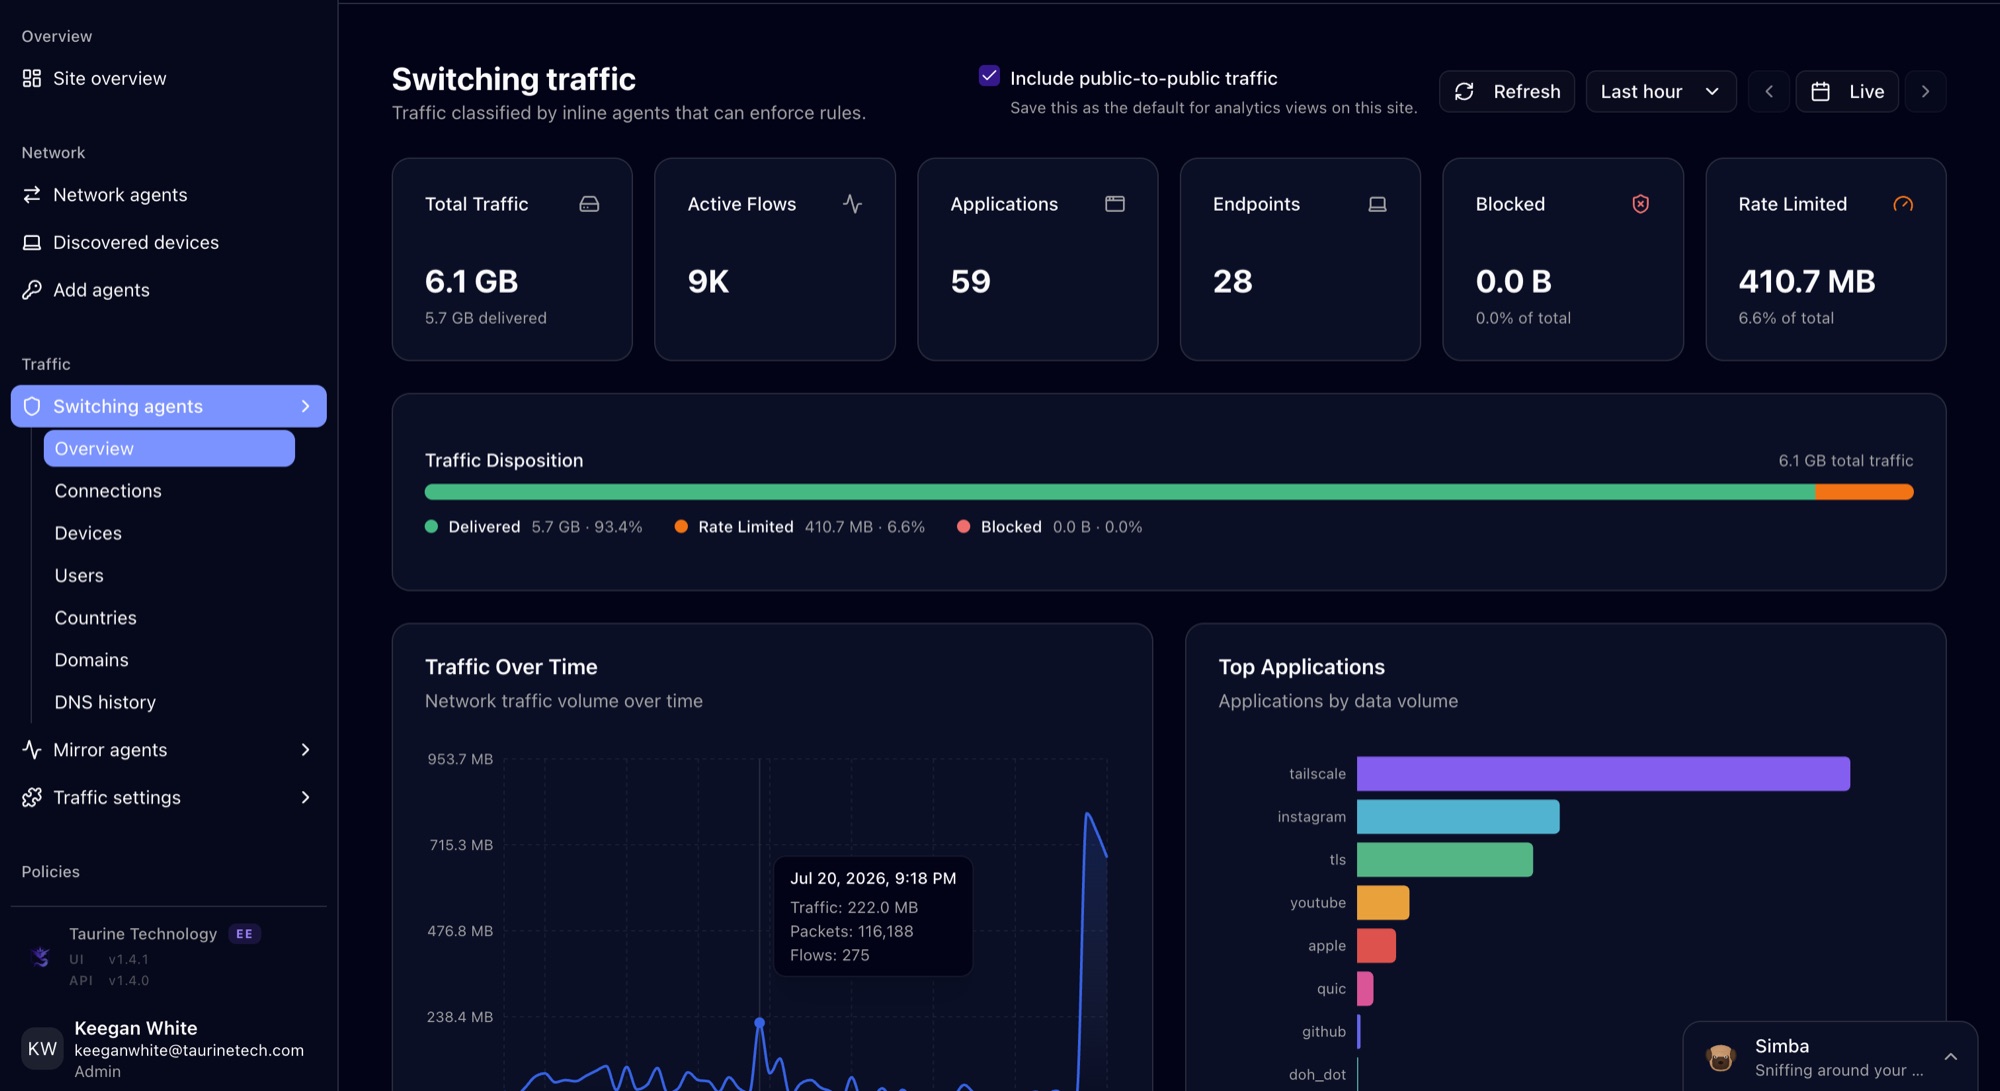
Live console — Delivered, rate-limited and blocked shares are measured.
How Axon classifies
Multiple signals. One custom heuristic. Lightweight enough to run on the edge.
Packet payload
Axon looks at the parts of the packet payload that remain informative under encryption, and combines them with other observable behaviour to triangulate the application.
Flow fingerprints
Each flow is fingerprinted on characteristics that do not change when the payload is encrypted. These survive QUIC, TLS 1.3 and most circumvention techniques.
Custom on-device heuristic
The signals feed a lightweight AI model that runs directly on the Axon agent. Classification is real-time, in-line, and does not send raw traffic anywhere.
→ Classifies as
First handful of packets · per flow · no raw traffic leaves the agent
04 · Diagnostics and baselines
Test from the site, not from the cloud.
Diagnostics run on the Axon edge device at the affected site, so they measure the path and service experience the customer actually sees. Every test is bounded to protect constrained hardware and metered links.
Cold/warm timing across system and public resolvers, failure classification and a hijack/interception canary for captive portals.
Capped checks with DNS, connect, TLS and TTFB phases, certificate validity and captive-portal detection.
Bounded UDP/ICMP TTL ramp with per-hop RTT and loss, distinguishing intermediate response loss from end-to-end target loss.
Bounded throughput with latency, jitter, loss and load context. When a cap is hit, the result reads “at least”, never “full capacity”.
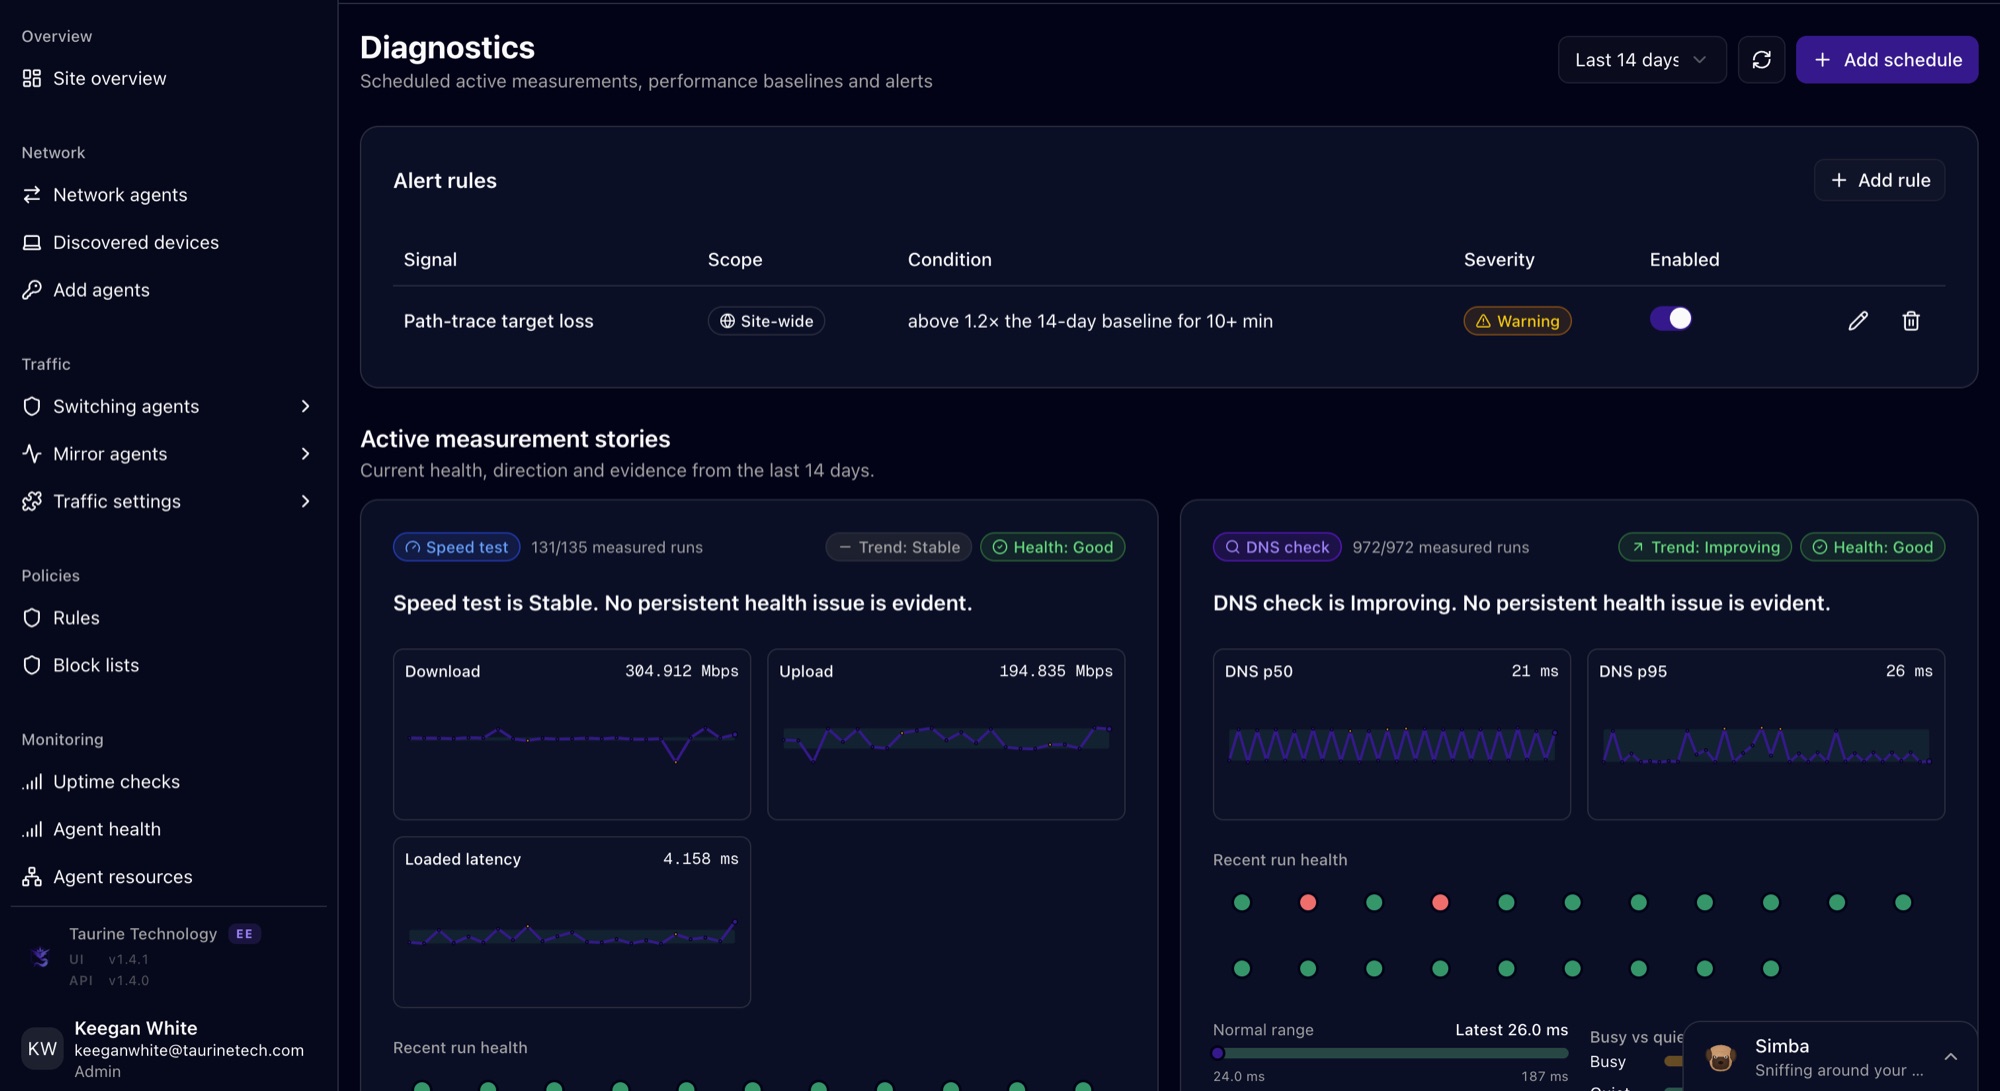
Live console — Trend and health are judged separately.
Baselines that respect busy hours
Measurements are separated into busy and quiet conditions with p50/p95 percentiles, so busy-hour degradation is never hidden inside one overall median. Trend and health verdicts are independent, and confidence is reported when history is thin.
From evidence to monitoring in one step
Recurring schedules build baselines automatically, with single-flight protection and intrusive-test safeguards. Any diagnostic story metric can become an alert rule with one action.
05 · Capacity and alerting
Know which uplink saturates first — and what is driving it
WAN capacity planning uses the subscribed service capacity. Saturation minutes, busy hours, p95 trends and projected weeks-to-saturation turn congestion into an evidence-based upgrade decision.
- p50/p95/max utilisation and saturation minutes per day
- Application contribution during saturated hours
- Absolute and 14-day baseline-relative alert rules with debounce
- In-app inbox, email, Slack, Discord, Teams and signed webhooks
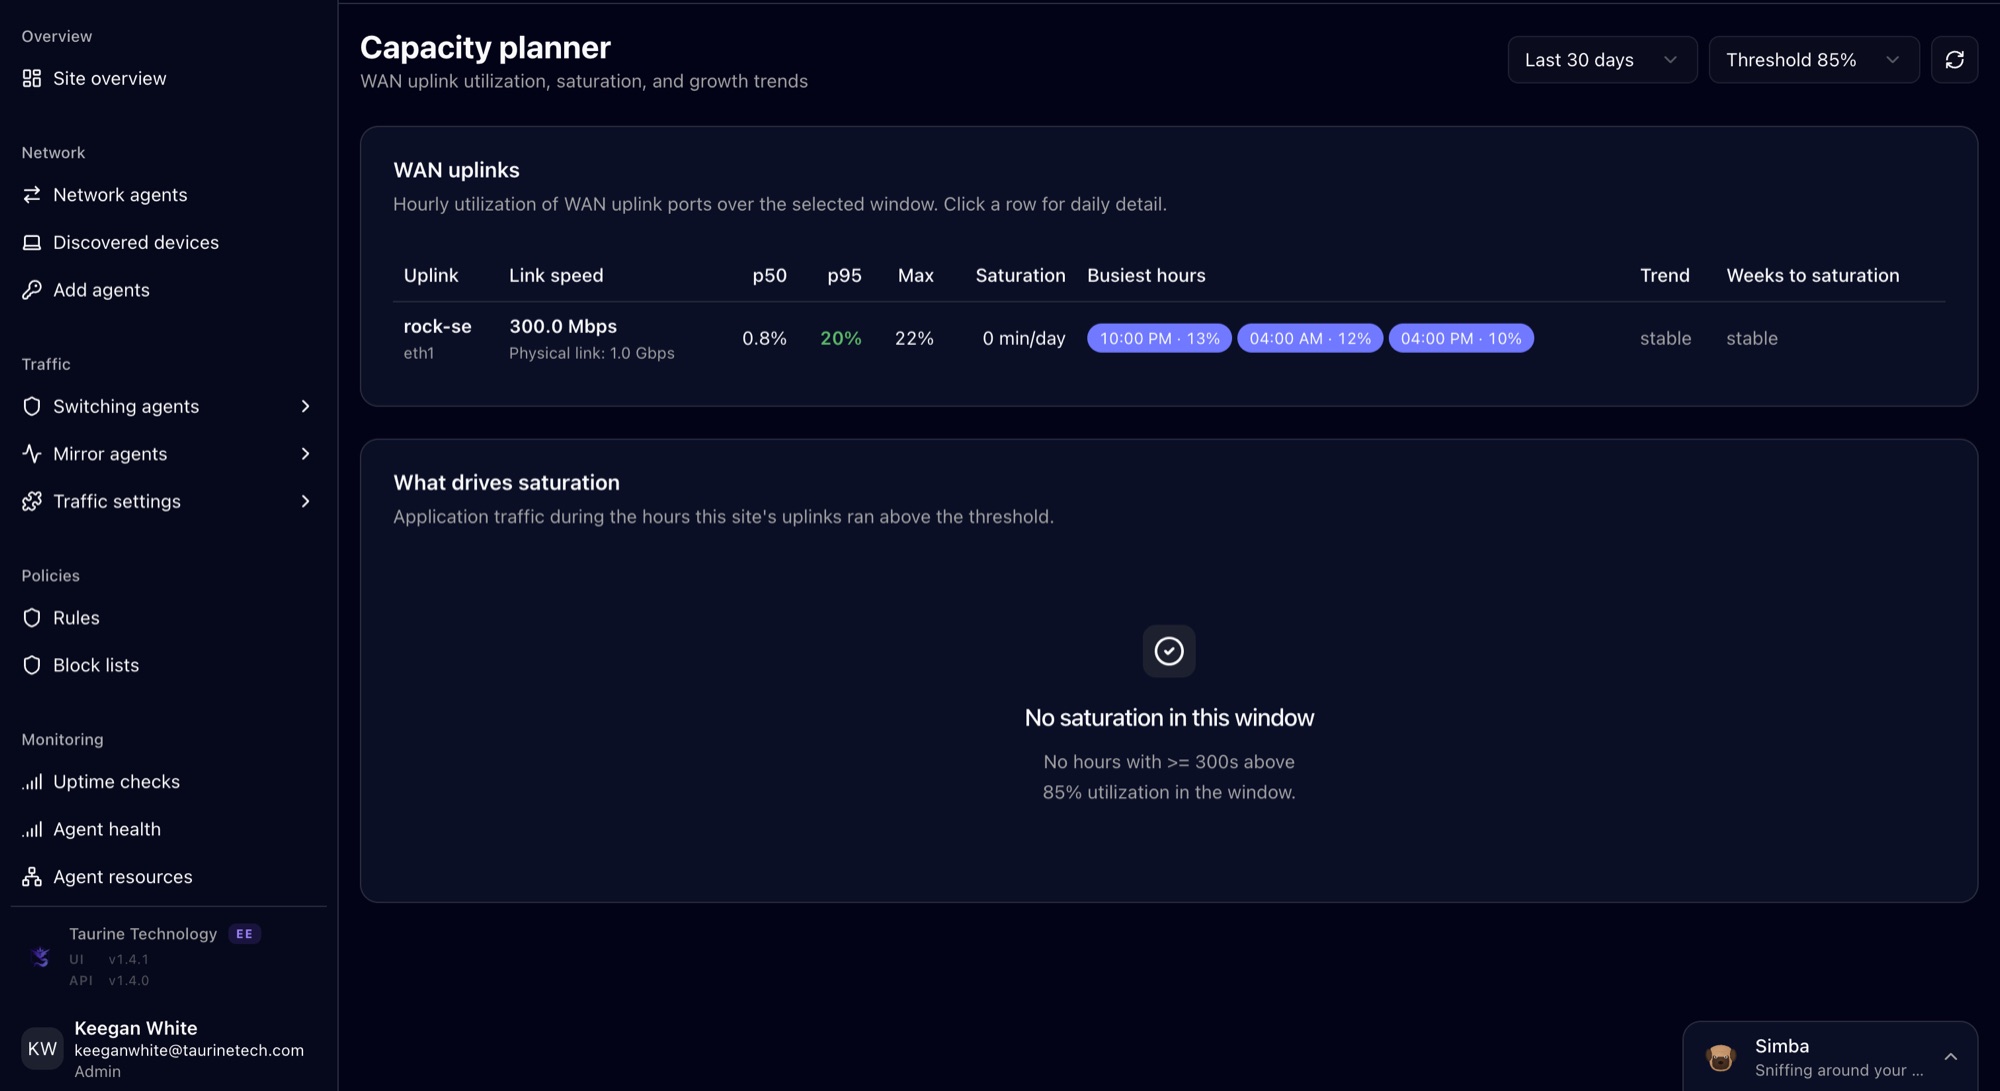
Live console — Service capacity is the basis.
06 · Policy and control
Turn visibility into policy — and verify the effect.
Block or rate-limit applications, categories, endpoints, IP ranges and domains. Scope rules globally, by site, switch or device, and schedule them for the days and times they should apply. Axon records what traffic was actually delivered, blocked or limited, so configured intent can be checked against observed effect.
Block or rate-limit by application or category, without maintaining changing IP lists.
IP, CIDR, observed SNI domains and wildcard patterns, plus custom block lists.
Fleet, site, switch or single endpoint, with IP/CIDR qualifiers, time windows and weekday constraints.
Policy is cached at the edge, so enforcement keeps running when the controller link is intermittent.
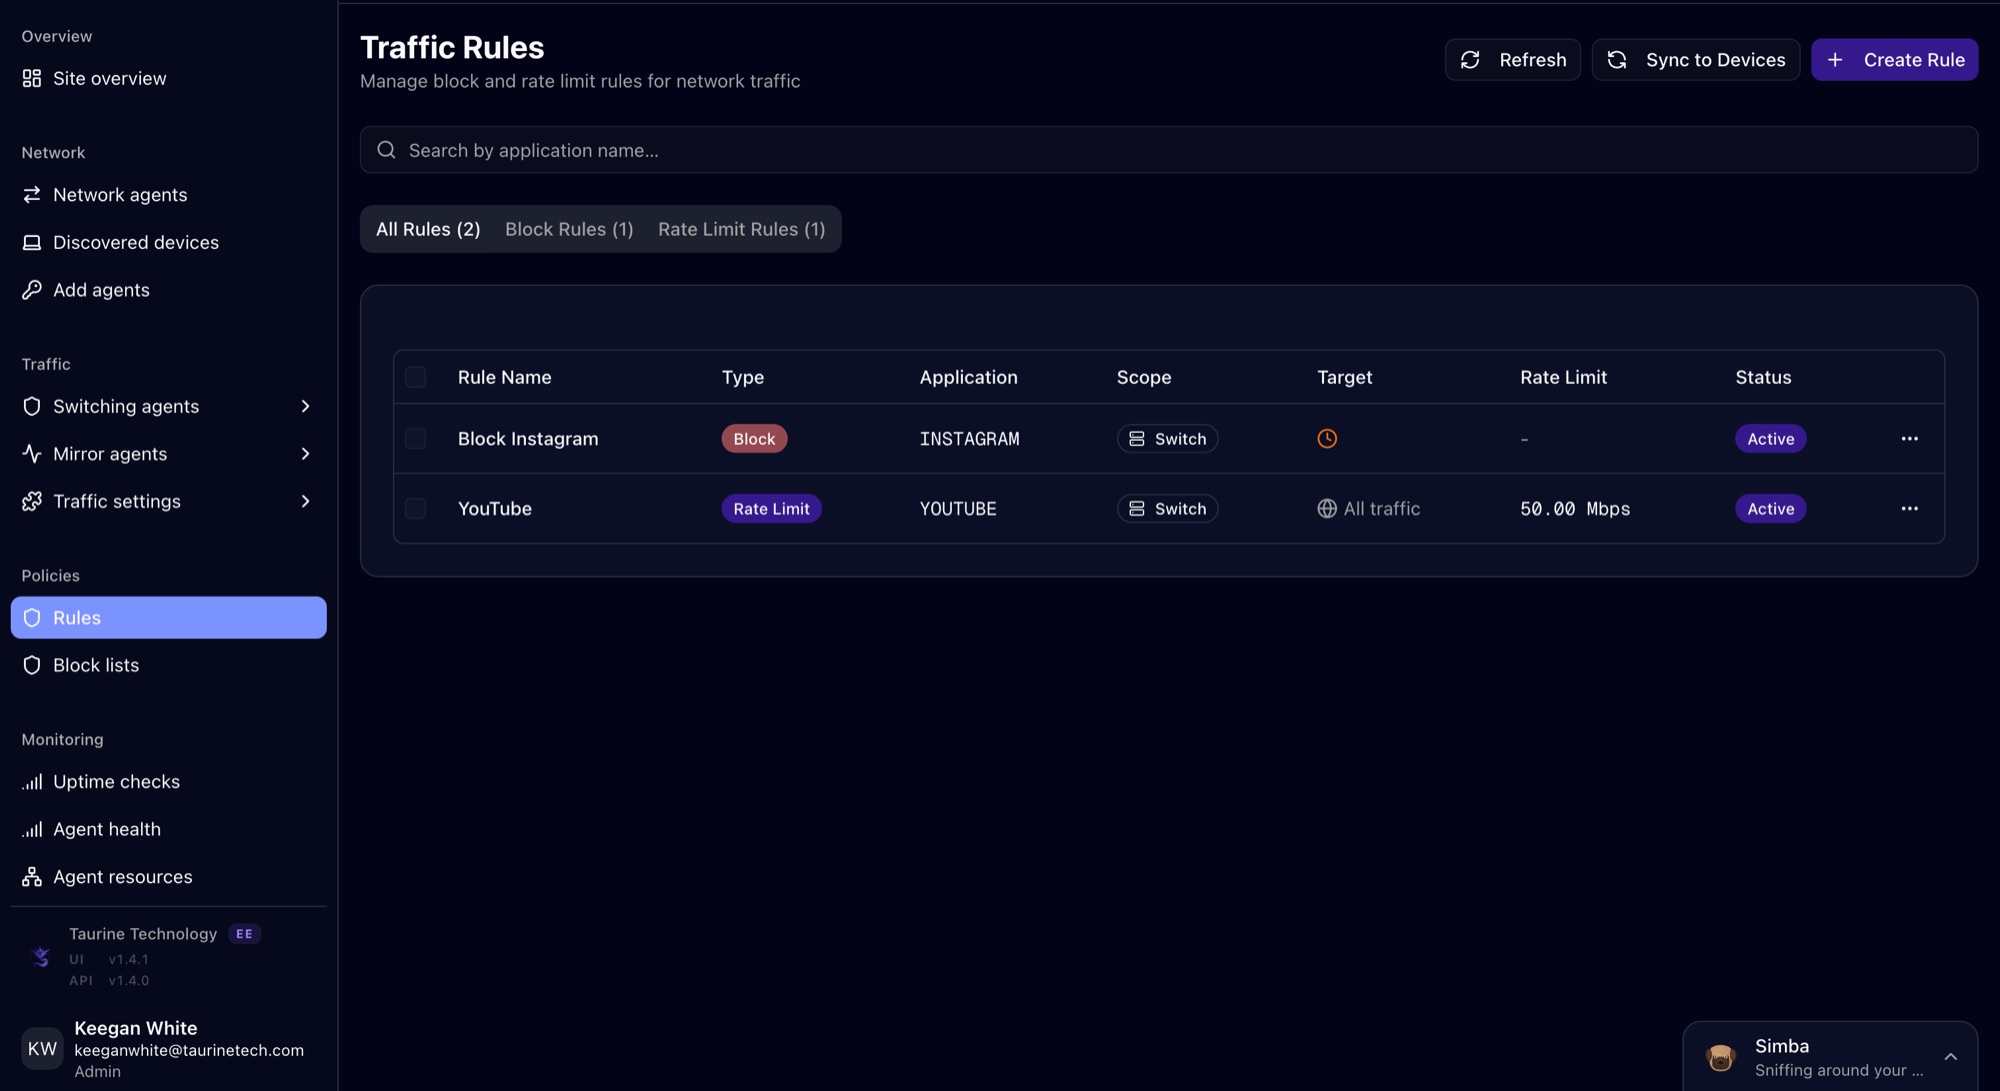
Live console — One block rule, one rate limit.
07 · Fleet lifecycle
Create a token and install in minutes.
Token-based enrollment assigns each device to the correct site, joins the private management network, validates interfaces and reports progress back to the controller.
- Bounded enrollment tokens
- Staged update slots
- Per-site release channels and staged rollout policy
- Clean remote decommissioning
Install timeline — recreated, representative data. Failed steps roll back via the transactional installer.
08 · Simba
And when you need an investigator, ask Simba.
Simba reads the same evidence you see — health, traffic, baselines, policy, capacity and recent changes — through typed, site-scoped tools, and explains the likely cause with its caveats attached.